DynoJet
Results

Index
Introduction
I have made
several runs on a DynoJet Dynamometer at Jeff's
Muffler & Performance. The dyno runs has shown some very
interesting results, some of which where unexpected.
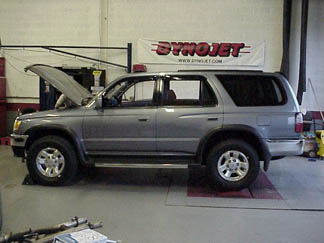
I have tested many bolt on performance items on my
1996 Toyota 4Runner 3.4L 4x4 with an automatic
transmission.
There are three
bolt on performance items that will remain constant
throughout all of the dyno runs: TRD Supercharger,
Edelbrock Headers, and Borla Cat-Back exhaust system
(no I am not going to take those headers off!). My
4Runner had approximately 73,000 miles on it at the
time of the tests.
I wish I would
have know that there was a DynoJet just 10 minutes
from my house so I could have done before and after
tests for the headers, exhaust, and supercharger.
I am offering
these results to simply show how effective the items
where on MY truck, which may or may not be the same
if they where installed on YOUR truck.
In the July 1999
issue of Sport Compact Car there is a nice
article on the use of the DynoJet. The DynoJet they
used belongs to Jackson Racing. It goes into how the
results can be altered to prove a point and common
mistakes made. I made every effort to insure my
results were constant and accurate. I do not sell any
of this stuff and have nothing to gain by
misrepresenting anything.
Return to
Index
Kenne
Bell Boost-A-Pump
I have had some
suspicions that my engine may not be getting enough
fuel under high boost conditions. To supplement fuel
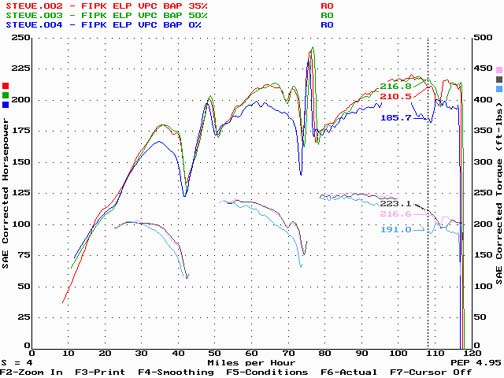
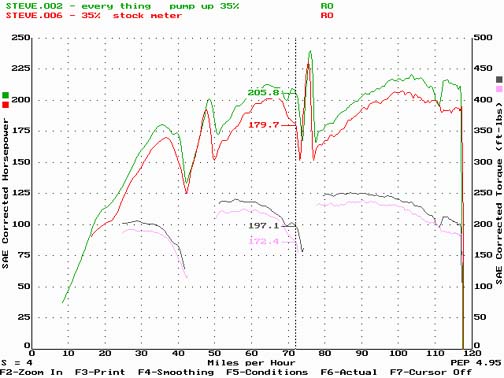
delivery I have installed a Kenne Bell Boost-A-Pump (BAP). Well, here are the results:
Configuration and
results:
Configuration
|
1st
|
2nd
|
3rd
|
| Run 2 BAP 35% |
173.6 HP |
205.8 HP |
216.8 HP |
| Run 3 BAP 50% |
174.4 HP |
209.5 HP |
210.5 HP |
| Run 4 BAP 0% |
146.9 HP |
175.6 HP |
185.7 HP |
As you can see
there is a very dramatic increase in performance.
These tests where done with the following setup:
K&N FIPK, VPC, and ELP ECU.
The results speak
for them selves. In the second gear pull showed 33.9
HP increase. In the third gear pull where the red
line starts dropping badly there is an increase of
31.1 HP
Exhaust Gas
Temperatures (EGT) where as follows:
Run 4 (BAP 0%)
peak 1655
degrees F
Run 2 (BAP
35%) peak 1579 degrees F
Run 3 (BAP
50%) peak 1577 degrees F
What I found is
that with the BAP the EGT would stay in the mid 1400s
until the very end in each gear where it would
suddenly spike to the temperatures indicated with a
sudden reduction in fuel pressure. It showed up in
the charts as a dip in the line toward the end of
each gear pull. The runs without the BAP the EGT
stayed very close to the peak through out the entire
run.
I have a theory
why it was doing this. It may be possible that the
fuel is being removed from the tank faster than air
can enter to replace it (emission vapor recovery
system). This may be causing a negative pressure in
the tank making it harder to draw fuel out. I have
seen this on aircraft with faulty fuel vents. It can
be so bad that I have seen wings imploded due to the
high vacuum levels in the wing tanks. If I return to
the dyno and see this again I will remove the gas cap
to see if it makes a difference.
I am not an expert
with automotive engines, but those EGT readings seem
very high. This might explain why I was burning out
exhaust system gaskets before I installed the ELP
ECU.
The BAP runs about
$225. For the HP increases and the reduction in EGT I
would recommend that you consider installing a BAP.
It would be nice to get some dyno results on later
model years.
Configuration and
results:
Configuration
|
1st
|
2nd
|
3rd
|
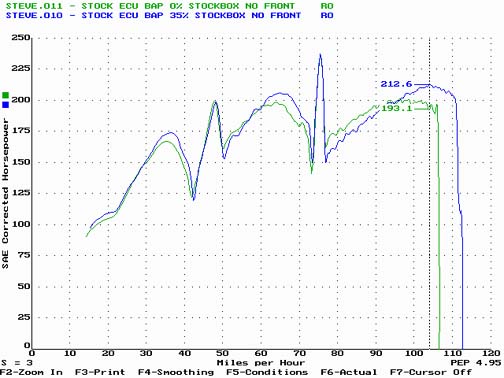
| Run 10 Stock ECU,
BAP 35% |
170.1 HP |
201.6 HP |
212.6 HP |
| Run 11 Stock ECU,
BAP 0% |
159.2 HP |
186.9 HP |
193.1 HP |
This test used the
stock ECU and the Stock air box with the front cut
open.
The results showed
a 10.9 HP gain in 1st, 14.7 HP gain in 2nd and a 19.5
HP in 3rd. The EGT with the BAP peaked at 1544 right
at the end again with staying in the mid 1400s
through most of the pull. The EGT without the BAP
stayed right near the peak of 1581 through out the
pull.
You will notice
right after the shifts the BAP runs dips below the
non-BAP run. A setting of 25% instead of 35% would
most likely would have kept it above the non-BAP run.
It might be a little to rich at 35% in this
configuration.
Return to
Index
Airfliter
combinations
There has been a
great deal of debate over different air filter
combinations on the 3.4. I have set up a test
consisting of four different dyno runs and the
results suprised me. The results have to be displayed
on two charts because only three runs can be
displayed on a single chart. All of these
runs where done using the stock air flow meter.
Configuration and
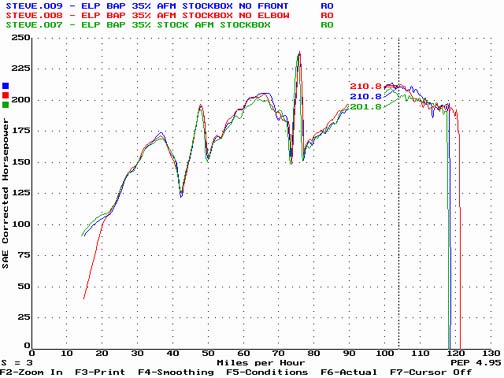
Results: *Note- runs with the stock
air-box used a replacement drop in K&N filter*
Configuration
|
1st
|
2nd
|
3rd
|
| Run 9 Stock Box No
Front |
173.3 HP |
205.5 HP |
210.8 HP |
| Run 8 Stock Box No
Elbow |
170.7 HP |
205.1 HP |
210.8 HP |
| Run 7 Stock Box |
168.8 HP |
199.5 HP |
201.8 HP |
This chart is
shown to compare the Gadget modified air-box with the front removed, and the stock
air-box with the elbow removed. To modify the
air-box, I cut opened the front of the air-box to
allow more air flow.
I informed TRD
that I was making these runs and they asked me to do
one with the "elbow" removed. This elbow is
the connection with the inner fender wall that the
air-box draws air through. This elbow is connected
inside of the fender to a tube that looks like it
goes up to the highest point inside of the fender.
This is most likely to give the 4Runner better water
crossing capability. The elbow has a tight 90 degree
turn as it passes through the fender and looks very
restrictive.
What this chart
shows is that the modification I made by cutting the
air-box open is just very slightly better than just
removing the elbow, but you can see the lines run
almost identical except for two very small places.
These two very small places I feel are really
insignificant.
Now look at the
next chart and be amazed!!!
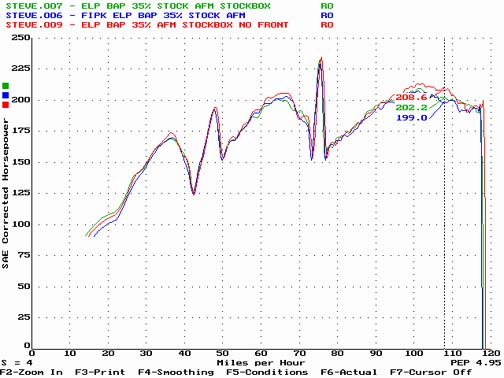
Configuration
& Results:*Note- runs with the stock
air-box used a replacement drop in K&N filter*
Configuration
|
1st
|
2nd
|
3rd
|
| Run 9 Stock Box No
Front |
173.3 HP |
205.5 HP |
208.6 HP |
| Run 7 Stock Box |
168.8 HP |
199.5 HP |
202.2 HP |
| Run 6 K&N FIPK |
169.4 HP |
202.3 HP |
199.0 HP |
This is the test
that is sure to get some folks upset. Performance
products is selling the K&N FIPK for $219. The K&N FIPK beats the
stock box by .6 HP in 1st, 2.8 in 2nd, but looses to
the stock box by 3.2 in 3rd for an average loss of
.06 HP.
Now if you just
cut open the front of the box you get 6.4 HP over the
stock box for free or 9.6 over the K&N FIPK.
Remember from the previous chart you will get
basically the same results by removing the elbow as
cutting open the box. I think this might be the way
to go so you can pop it back in if you decide to go
swimming.
It looks like TRD
is right about this one, or close anyway. They told
me that they have seen a slight reduction in power,
to no improvement with the installation of the
K&N FIPK. Of course it does look cool, well once
your hood is open anyway.
Return to
Index
HKS
Vein Pressure Converter
This chart
compares the difference between the stock air flow
meter (AFM) and the E
L Prototypes (ELP)
modified HKS Vein Pressure Converter (VPC).
ELP Claimed an
increase of 11 HP. My tests show that the increase is
26.1HP in the 2rd gear pull. Torque increase was 24
Ft-lb. Isn't it amazing that there is really someone
out there that under claims there products.
These test where
done with the K&N FIPK. When I go back to the
dyno I will redo them with my modified air-box. Just
think another 9 HP over this.
I have been
driving around with the stock AFM installed after the
dyno runs and the loss in HP is very noticeable.
Return to
Index
Dyno
Run Movie
Click here to down load a movie of one
of my dyno runs.
Return to
Index
|